Tuesday, November 07, 2006

BELAJAR DAN BERMAIN FOREX

BELAJAR DAN ERMAIN FOREX (SIMPLE, MUDAH DAN MENJANJIKAN)

Bagi anda yang ingin Mendapatkan Pendapatan Yang bisa dibilang tidak disedikit ini adalah cara yang termudah dengan meluangkan waktu sedikit di internet untuk bisa mewujudkannya. Pada kali ini saya akan menjelaskan bagaimana kita bermain Forex, dan Apa itu Forex serta bagaimana kita bisa menajdi untuk dengan bermain Forex.

FOREX TRADING (valas trading) merupakan pasar terbesar di dunia diukur berdasarkan nilai total transaksi. Menurut survei BIS (Bank International for Settlement-bank sentralnya bank-bank sentral seluruh dunia), yang dilakukan pada akhir tahun 2004, nilai transaksi forex mencapai USD 1,900 miliar per hari. Dengan demikian, prospek investasi di perdagangan forex adalah sangat bagus.

Pasar valas/forex berjalan selama 24 jam, berputar mulai dari pasar New Zaeland & Australia yang berlangsung pukul 05.00-14.00 WIB, terus ke pasar Asia yaitu Jepang & Singapura yang berlangsung pukul 07.00-16.00 WIB, ke pasar Eropa yaitu Jerman & Inggris yang berlangsung pukul 13.00-22.00, sampai ke pasar Amerika yang berlangsung pukul 20.30-10.30. Dalam perkembangan sejarahnya, bank sentral milik negara-negara dengan cadangan mata uang asing yang besar sekalipun dapat dikalahkan oleh kekuatan pasar forex/valas yang bebas.

Forex trading (valas trading) saat ini sudah sangat mudah untuk dilakukan oleh siapapun dan dari manapun. Dengan modal komputer yang tersambung ke internet, kita sudah bisa melakukan forex trading (valas trading) baik dari rumah, kantor, warnet, dan darimana saja yang penting ada fasilitas sambungan internet. Dengan mendaftar di Marketiva, Anda tidak perlu lagi memikirkan modal untuk melakukan forex trading (valas trading), begitu daftar langsung bisa trading karena Anda mendapatkan cash reward $5 real money untuk live trading dan $10,000 virtual money untuk simulasi dengan kondisi pasar yang sesungguhnya (demo). Belajar forex trading (valas trading) dengan metoda belajar sambil praktek akan membuat Anda lebih cepat memahami segala hal tentang forex trading (valas trading).


Transaksi real maupun belajar Forex Trading (valas trading) di Marketiva adalah pilihan terbaik bagi para calon trader dalam mengembangkan ilmu, maupun bagi trader profesional dalam bertransaksi forex trading (valas trading).

KEUNGGULAN
Marketiva provides spot forex on major currency pairs and crosses; $5 cash reward you can start trading right away; tight spreads from 3 pips; trading on 1% margin; virtual and live desks within one account; latest news, alerts on market events, signals, no market commissions; zero-interest on open positions, 24-hour support, chat channels, the most sophisticated and easy-to-use forex charting tool; ability to trade from the charts and the best forex trading software available!

Untuk bisa memulai transaksi sekaligus belajar forex trading (valas trading) di Marketiva, ikutilah langkah-langkah berikut secara berurutan.

MENDAFTAR
Untuk mendaftar, silakan buka website Marketiva, setelah terbuka, klik Open Account, isilah data diri Anda secara lengkap. Untuk field dengan tanda * (bintang) harus Anda isi, yang lain boleh Anda kosongkan.

www.marketiva-indonesia.blogspot.com
Username: pilihlah username yang indah, karena akan Anda gunakan untuk chatting dengan sesama trader, misalnya: cinta, cantik, handsome, dsb.
Password: minimal 8 karakter gabungan huruf dan angka.
First Name: isi nama depan Anda
Last Name: isi nama belakang Anda, jika nama Anda hanya terdiri dari satu suku kata, masukkan nama Anda tersebut di field First Name dan Last Name. Contoh: jika nama Anda adalah Fitri, maka masukkan First Name: Fitri, Last Name: Fitri.
Untuk data alamat isikan sesuai dengan KTP Anda.
E-mail: diisi alamat e-mail Anda yang masih aktif.
PERHATIAN: Seluruh data diri yang Anda isikan harus sama dengan KTP, karena akan dilakukan proses verifikasi untuk bisa melakukan transaksi forex trading (trading valas).
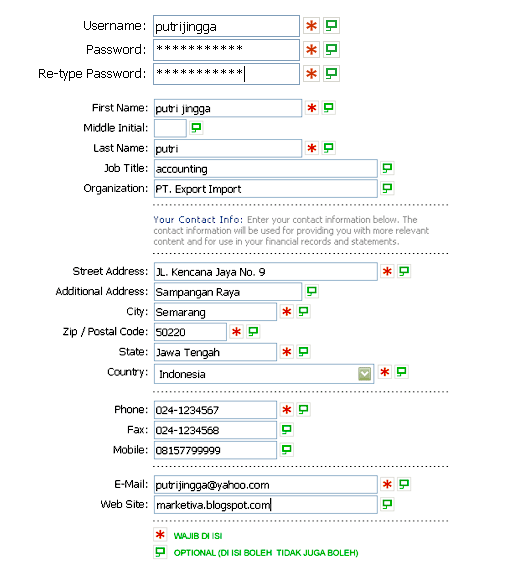
Setelah selesai mengisi, klik tombol Continue >>

User Template: pilih Standar Forex Trader
Coupon: boleh dikosongkan
Recovery Question: pilih yang paling cocok dengan Anda, misalnya Anda memiliki kucing dengan nama manis, maka pilih: What is your pet̢۪s name?
Recovery Answer: dalam contoh ini maka jawaban anda adalah: manis
Setelah selesai mengisi, klik tombol next >>

Berilah tanda chek pada pilihan: I have read, understood, and agree with the Service Agreement under which Marketiva Corporation provides it services and products. I have also read and understood the Risk Disclosure statement and I am willing and able to assume such risks.
Setelah itu klik tombol [finish]. Maka proses pendaftaran Anda sudah selesai.

VERIFIKASI IDENTITAS DIRI
Setelah Anda mendaftar, maka Anda perlu mengupload data diri Anda untuk diverifikasi, Anda hanya diizinkan membuka satu account. Anda tidak bisa melakukan penarikan dana sebelum melakukan identifikasi, dan ada kemungkinan account Anda di-suspend (dibekukan) jika Anda menggunakan komputer dengan IP address yang sama dengan trader lain. Untuk itu segeralah melakukan verifikasi identitas diri, berikut data yang diperlukan:

Image ID: Scan KTP/SIM/KTM atau kartu identitas lain yang ada foto dan nama Anda tertera di kartu identitas tersebut.
Image Adress: Scan data tagihan yang alamatnya sama dengan KTP/SIM/KTM Anda, misal tagihan listrik, tagihan telepon, rekening bank dll, data di tagihan ini digunakan untuk konfirmasi alamat.
Scan data harus berwarna dan masing-masing file ukurannya maksimal 100kb, jadi sewaktu scan, resolusi di set ke 72-100 dpi saja.
Bila Anda tidak mempunya data tagihan yang ada nama dan alamat Anda disitu, maka anda boleh mengupload scan ktp saja, scan bagian depan KTP sebagai ID image, bagian belakang sebagai Address image.
Upload scan data tersebut di sini
Setelah mengupload data, melaporlah ke live support yang ada di situs Marketiva. Beberapa saat kemudin Anda akan diberitahu bahwa data diri Anda telah selesai diverifikasi.

MEMBUKA ACCOUNT E-GOLD
Proses deposit dan withdrawl termudah adalah dengan e-gold, silakan Anda baca secara lengkap tata cara membuka e-gold, klik disini. PASTIKAN: Nama lengkap Anda di account e-gold harus sama dengan nama lengkap di Marketiva, jika tidak sama maka Anda akan mengalami kesulitan dalam proses deposit dan withdrawl.

Klik pada gambar Jika ingin Mendaftar di e-gold

Saturday, October 07, 2006

Pivot Point Trading

You are going to love this lesson. Using pivot points as a trading strategy has been around for a long time and was originally used by floor traders. This was a nice simple way for floor traders to have some idea of where the market was heading during the course of the day with only a few simple calculations.

The pivot point is the level at which the market direction changes for the day. Using some simple arithmetic and the previous days high, low and close, a series of points are derived. These points can be critical support and resistance levels.

The pivot level and levels calculated from that are collectively known as pivot levels.

Every day the market you are following has an open, high, low and a close for the day (some markets like forex are 24 hours but generally use 5pm EST as the open and close). This information basically contains all the data you need to calculate the pivot levels.

The reason pivot points are so popular is that they are predictive as opposed to lagging. You use the information of the previous day to calculate potential turning points for the day you are about to trade (present day).

Because so many traders follow pivot points you will often find that the market reacts at these levels. This give you an opportunity to trade.

Before I go into how you calculate pivot points, I just want to point out that I have put an online calculator and a really neat desktop version that you can download for free HERE

If you would rather work the pivot points out by yourself, the formula I use is below:

Resistance 3 = High + 2*(Pivot - Low)
Resistance 2 = Pivot + (R1 - S1)
Resistance 1 = 2 * Pivot - Low
Pivot Point = ( High + Close + Low )/3
Support 1 = 2 * Pivot - High
Support 2 = Pivot - (R1 - S1)
Support 3 = Low - 2*(High - Pivot)

As you can see from the above formula, just by having the previous days high, low and close you eventually finish up with 7 points, 3 resistance levels, 3 support levels and the actual pivot point.

If the market opens above the pivot point then the bias for the day is for long trades as long as price remains above the pivot point. If the market opens below the pivot point then the bias for the day is for short trades as long as the market remains below the pivot point.

The three most important pivot points are R1, S1 and the actual pivot point.

The general idea behind trading pivot points is to look for a reversal or break of R1 or S1. By the time the market reaches R2,R3 or S2,S3 the market will already be overbought or oversold and these levels should be used for exits rather than entries.

A perfect set up would be for the market to open above the pivot level and then stall slightly at R1 then go on to R2. You would enter on a break of R1 with a target of R2 and if the market was really strong close half at R2 and target R3 with the remainder of your position.

Unfortunately life is not that simple and we have to deal with each trading day the best way we can. I have picked a day at random from last week and what follows are some ideas on how you could have traded that day using pivot points.


On the 12th August 04 the Euro/Dollar (EUR/USD) had the following:
High - 1.2297
Low - 1.2213
Close - 1.2249

This gave us:

Resistance 3 = 1.2377
Resistance 2 = 1.2337
Resistance 1 = 1.2293
Pivot Point = 1.2253
Support 1 = 1.2209
Support 2 = 1.2169
Support 3 = 1.2125

Have a look at the 5 minute chart below

Have a look at the 5 minute chart below

forex

The green line is the pivot point. The blue lines are resistance levels R1,R2 and R3. The red lines are support levels S1,S2 and S3.

There are loads of ways to trade this day using pivot points but I shall walk you through a few of them and discuss why some are good in certain situations and why some are bad.

The Breakout Trade

At the beginning of the day we were below the pivot point, so our bias is for short trades. A channel formed so you would be looking for a break out of the channel, preferably to the downside. In this type of trade you would have your sell entry order just below the lower channel line with a stop order just above the upper channel line and a target of S1. The problem on this day was that, S1 was very close to the breakout level and there was just not enough meat in the trade (13 pips). This is can be a good entry technique for you. Just because it was not suitable this day, does not mean it will not be suitable the next day.

fx

The Pullback Trade

This is one of my favorite set ups. The market passes through S1 and then pulls back. An entry order is placed below support, which in this case was the most recent low before the pullback. A stop is then placed above the pullback (the most recent high - peak) and a target set for S2. The problem again, on this day was that the target of S2 was to close, and the market never took out the previous support, which tells us that the market sentiment is beginning to change.

bid-ask

Advanced

As I mentioned earlier, there are lots of ways to trade with pivot points. A more advanced method is to use the cross of two moving averages as a confirmation of a breakout. You can even use combinations of indicators to help you make a decision. It might be the cross of two averages and also MACD must be in buy mode.

In the example below the market passed through S1 and then retraced to the S1 line again. It then formed a channel. At around this time we had a cross of the averages, MACD signaled buy and there was a breakout of the channel line. This gave a great signal to go long with a target of the original pivot line.

Mess around with a few of your favorite indicators to help determine an entry around a pivot level but remember the signal is a break of a level and the indicators are just confirmation.

interbank

We haven't even got into patterns around pivot levels or failures but that is not the point of this lesson. I just want to introduce another possible way for you to trade.

Good Trading
Mark McRae


Information, charts or examples contained in this lesson are for illustration and educational purposes only. It should not be considered as advice or a recommendation to buy or sell any security or financial instrument. We do not and cannot offer investment advice. For further information please read our disclaimer.